Computer Geometric Art
This is a book by Ian Angell, published in 1985, with many examples of repeating geometric patterns created using a series of Fortran programs written by the author.
According to the introduction:
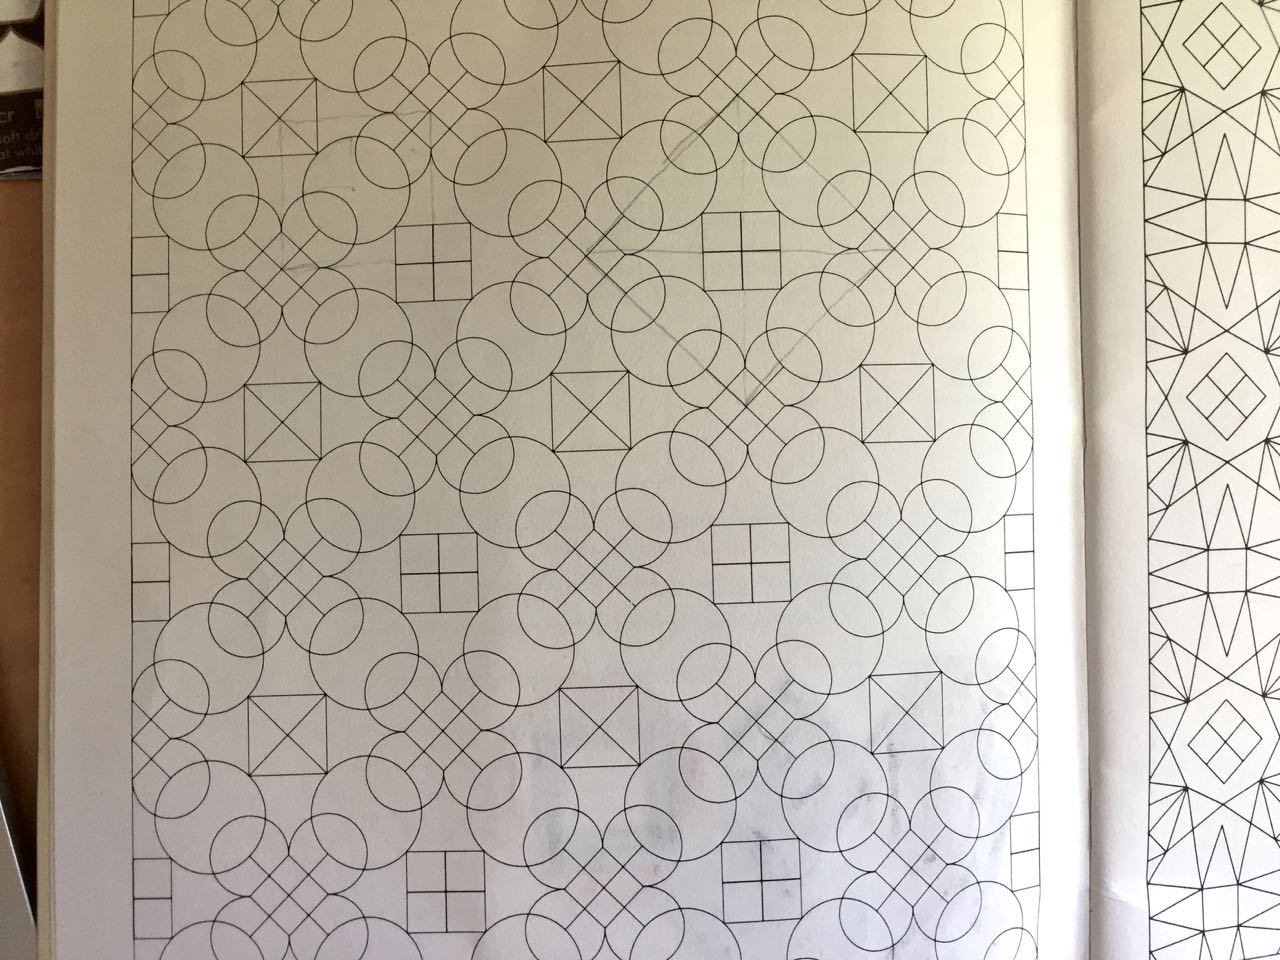
To draw a lattice pattern, the computer first has to generate a “tile”; the computer takes an elementary set of line segments and arcs, and manipulates them using a space group (a sequence of reflections, rotations and translations on the original set) into a tile, which introduces some initial symmetry. The tiles are then stacked in a regular lattice … thus initiating further symmetries. … Clipping is used to restrict the pattern to a finite rectangle.
Making one tile
I picked a pattern (on page 2) to see if I could replicate this process in Processing, and perhaps also plot it out…

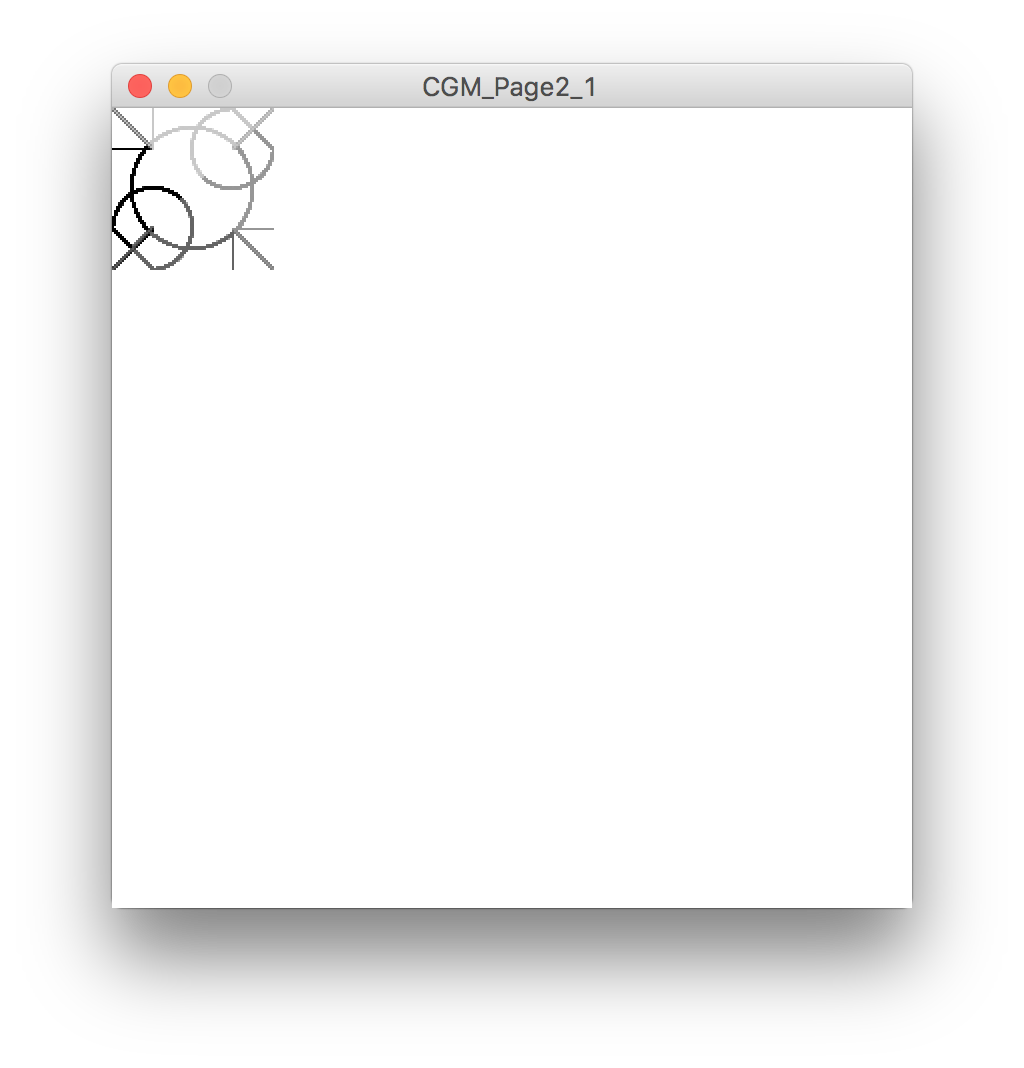
Sketch: cgm_page2_1.pde
This sketch draws one tile, comprised of 4 sub-tiles. I used different colours for each quadrant to help me debug the translations and get them to line up properly.

Nesting tiles and controlling transformations
This works fine for one tile, but as this excellent video explains, “translations accumulate”:
The Coding Train: Transformations Pt.1 (Translate, Rotate, Push/Pop) - p5.js Tutorial
So every time I rotate, move or flip a tile, I need to reset the matrix.
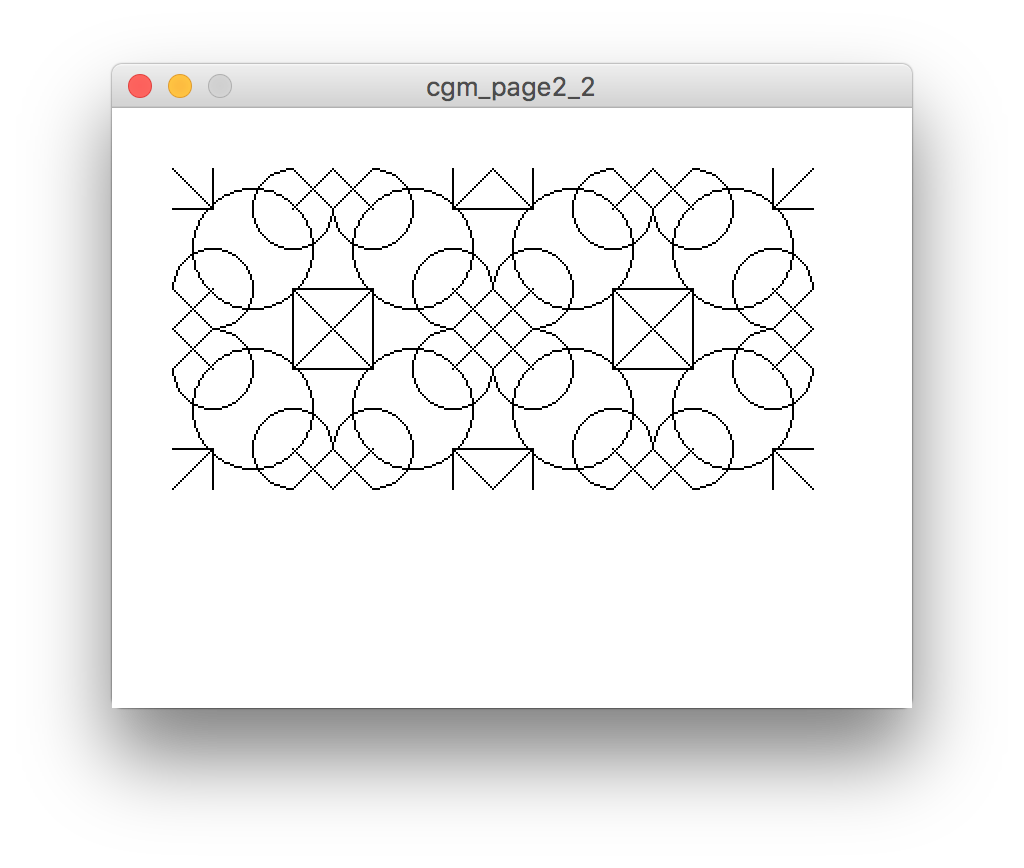
Sketch: cgm_page2_2.pde
This sketch builds on the previous one in a couple of ways:
- It uses
popMatrix()andpushMatrix()between each transformation to reset the canvas to it’s defaults, which makes the translations easier to calculate - It uses nested objects; each tile is an object, and each space group is also an object made up of 4 tiles
- It also uses a few functions to tidy up the code and reduce CPU usage, since I’m not doing any animation
The result:

Drawing the array out on a grid
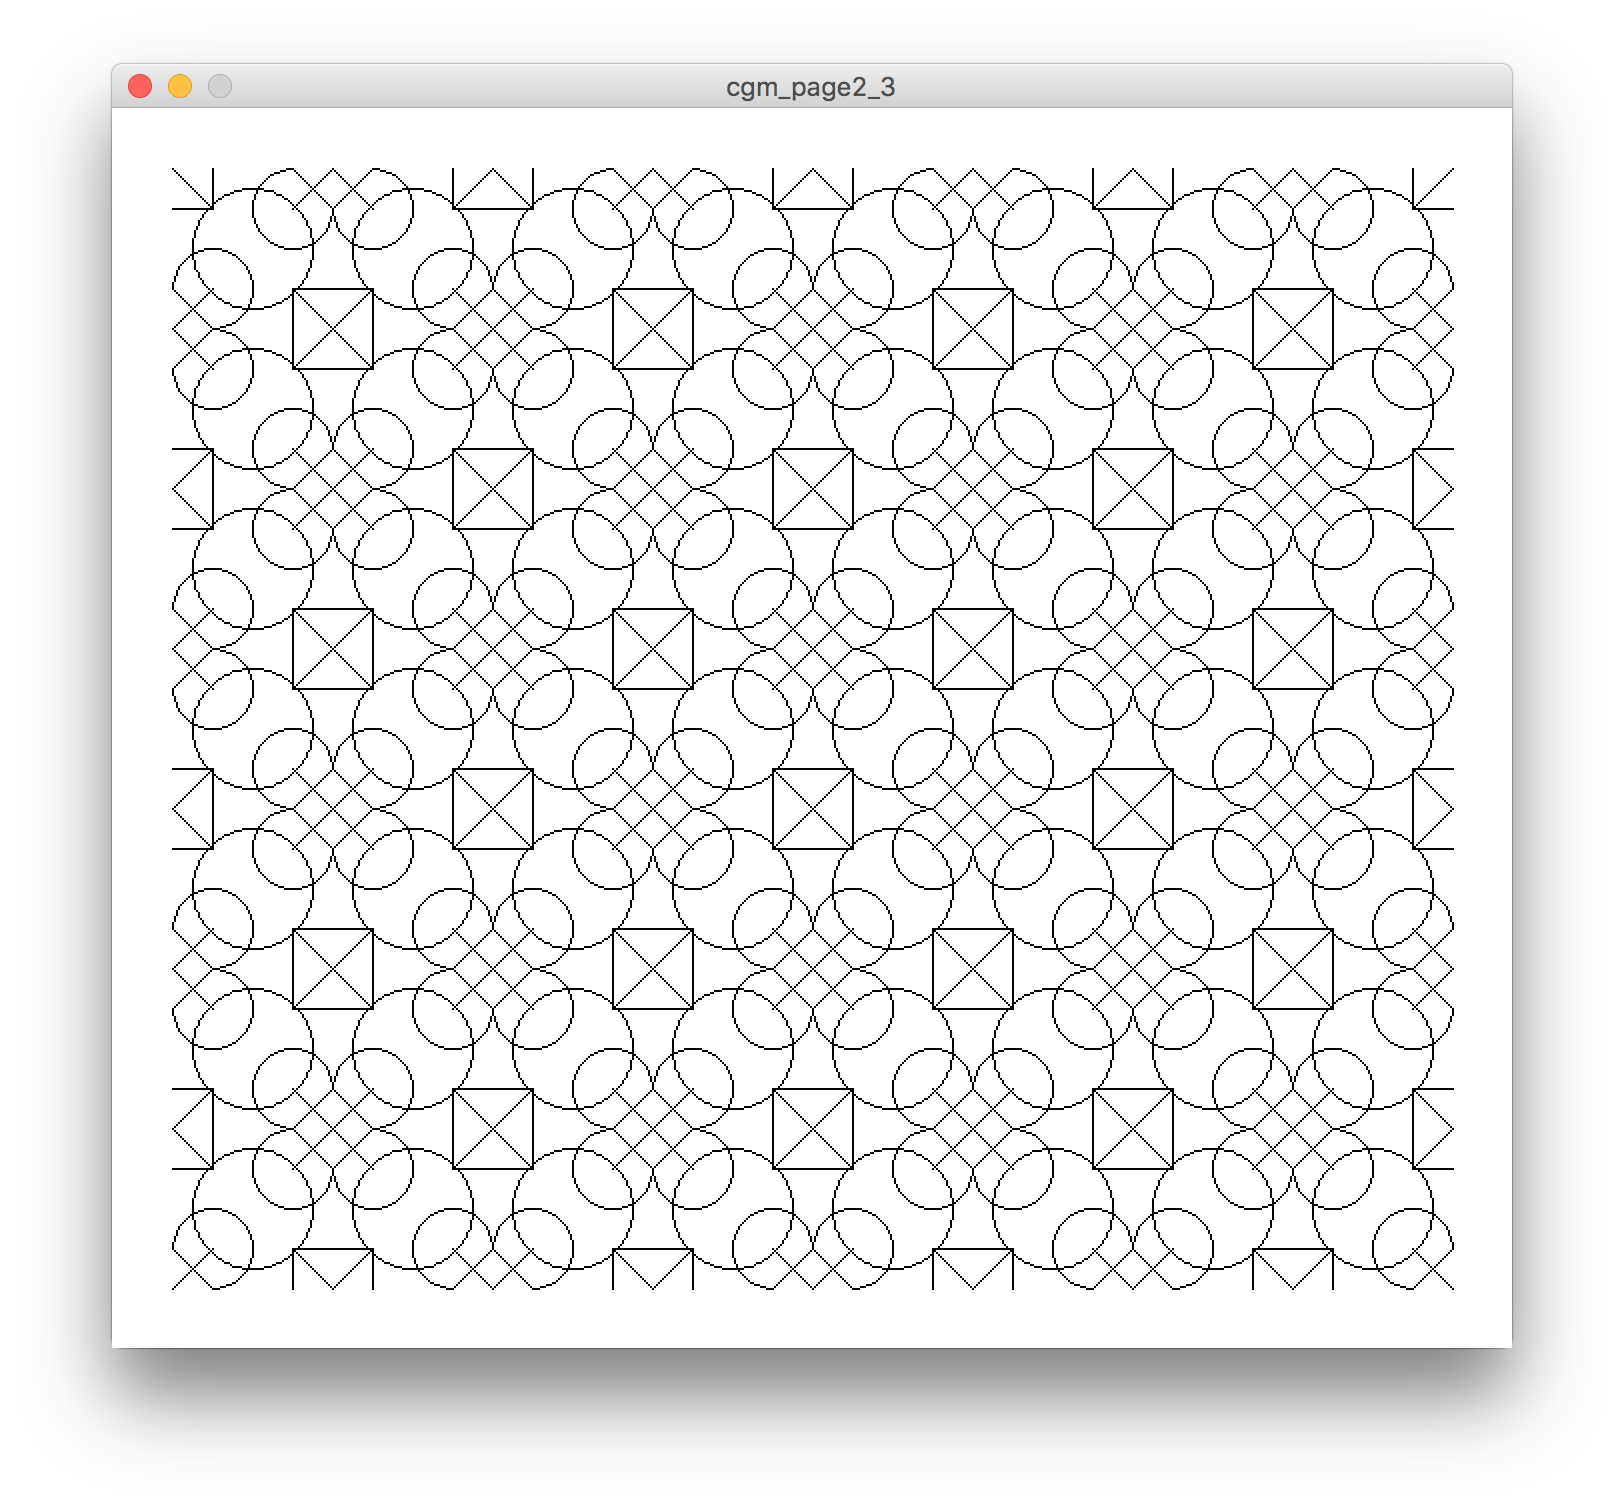
Sketch: cgm_page2_3.pde
Using a technique I learned from Tobias Toft, I used a grid of rows and columns to print a repeating pattern of SpaceGroup objects. I also had to introduce some translation logic into each cell of the grid to mirror the SpaceGroup each row (in the y-axis) and each column (in the x-axis)
The result:
