After Vasarely
I read this post about using JavaScript to simulate a well-known op-art painting by Viktor Vasarely. The author did a pretty good job, so I thought I’d have a go in Processing, with a different painting – this one:
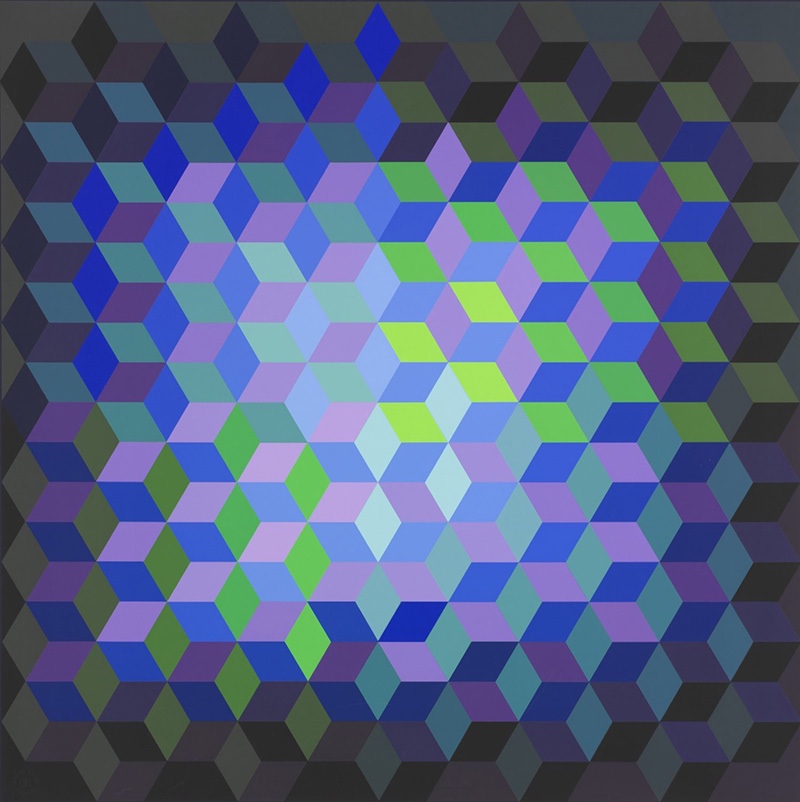
I don’t know what it’s called, but I found it here. Spoilers: it turns out this was not a good choice to try and recreate programmatically, but I had some fun finding out.
Sketch: vasarely_traces_7.pde
Here’s my result:
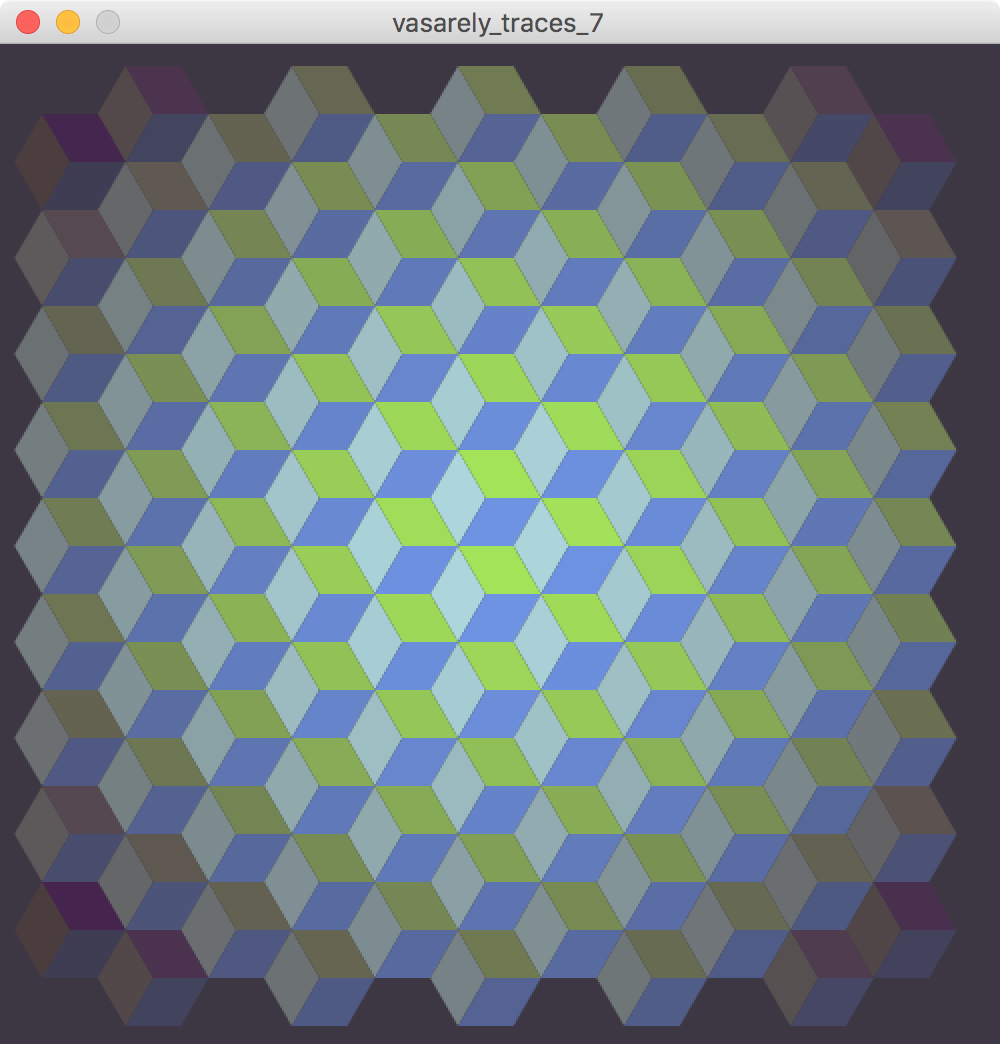
There’s more I could do to this to make the resemblance closer, but the flaws in my approach are quite structural, so I’d be better off doing it again with a different approach. I’d rather play with it and do something different.
Anyway, I solved some interesting problems with this sketch…
More trigonometry
I’ve had to do a bit of trigonometry before, but here, I spent ages working out how to draw each face of the cube.
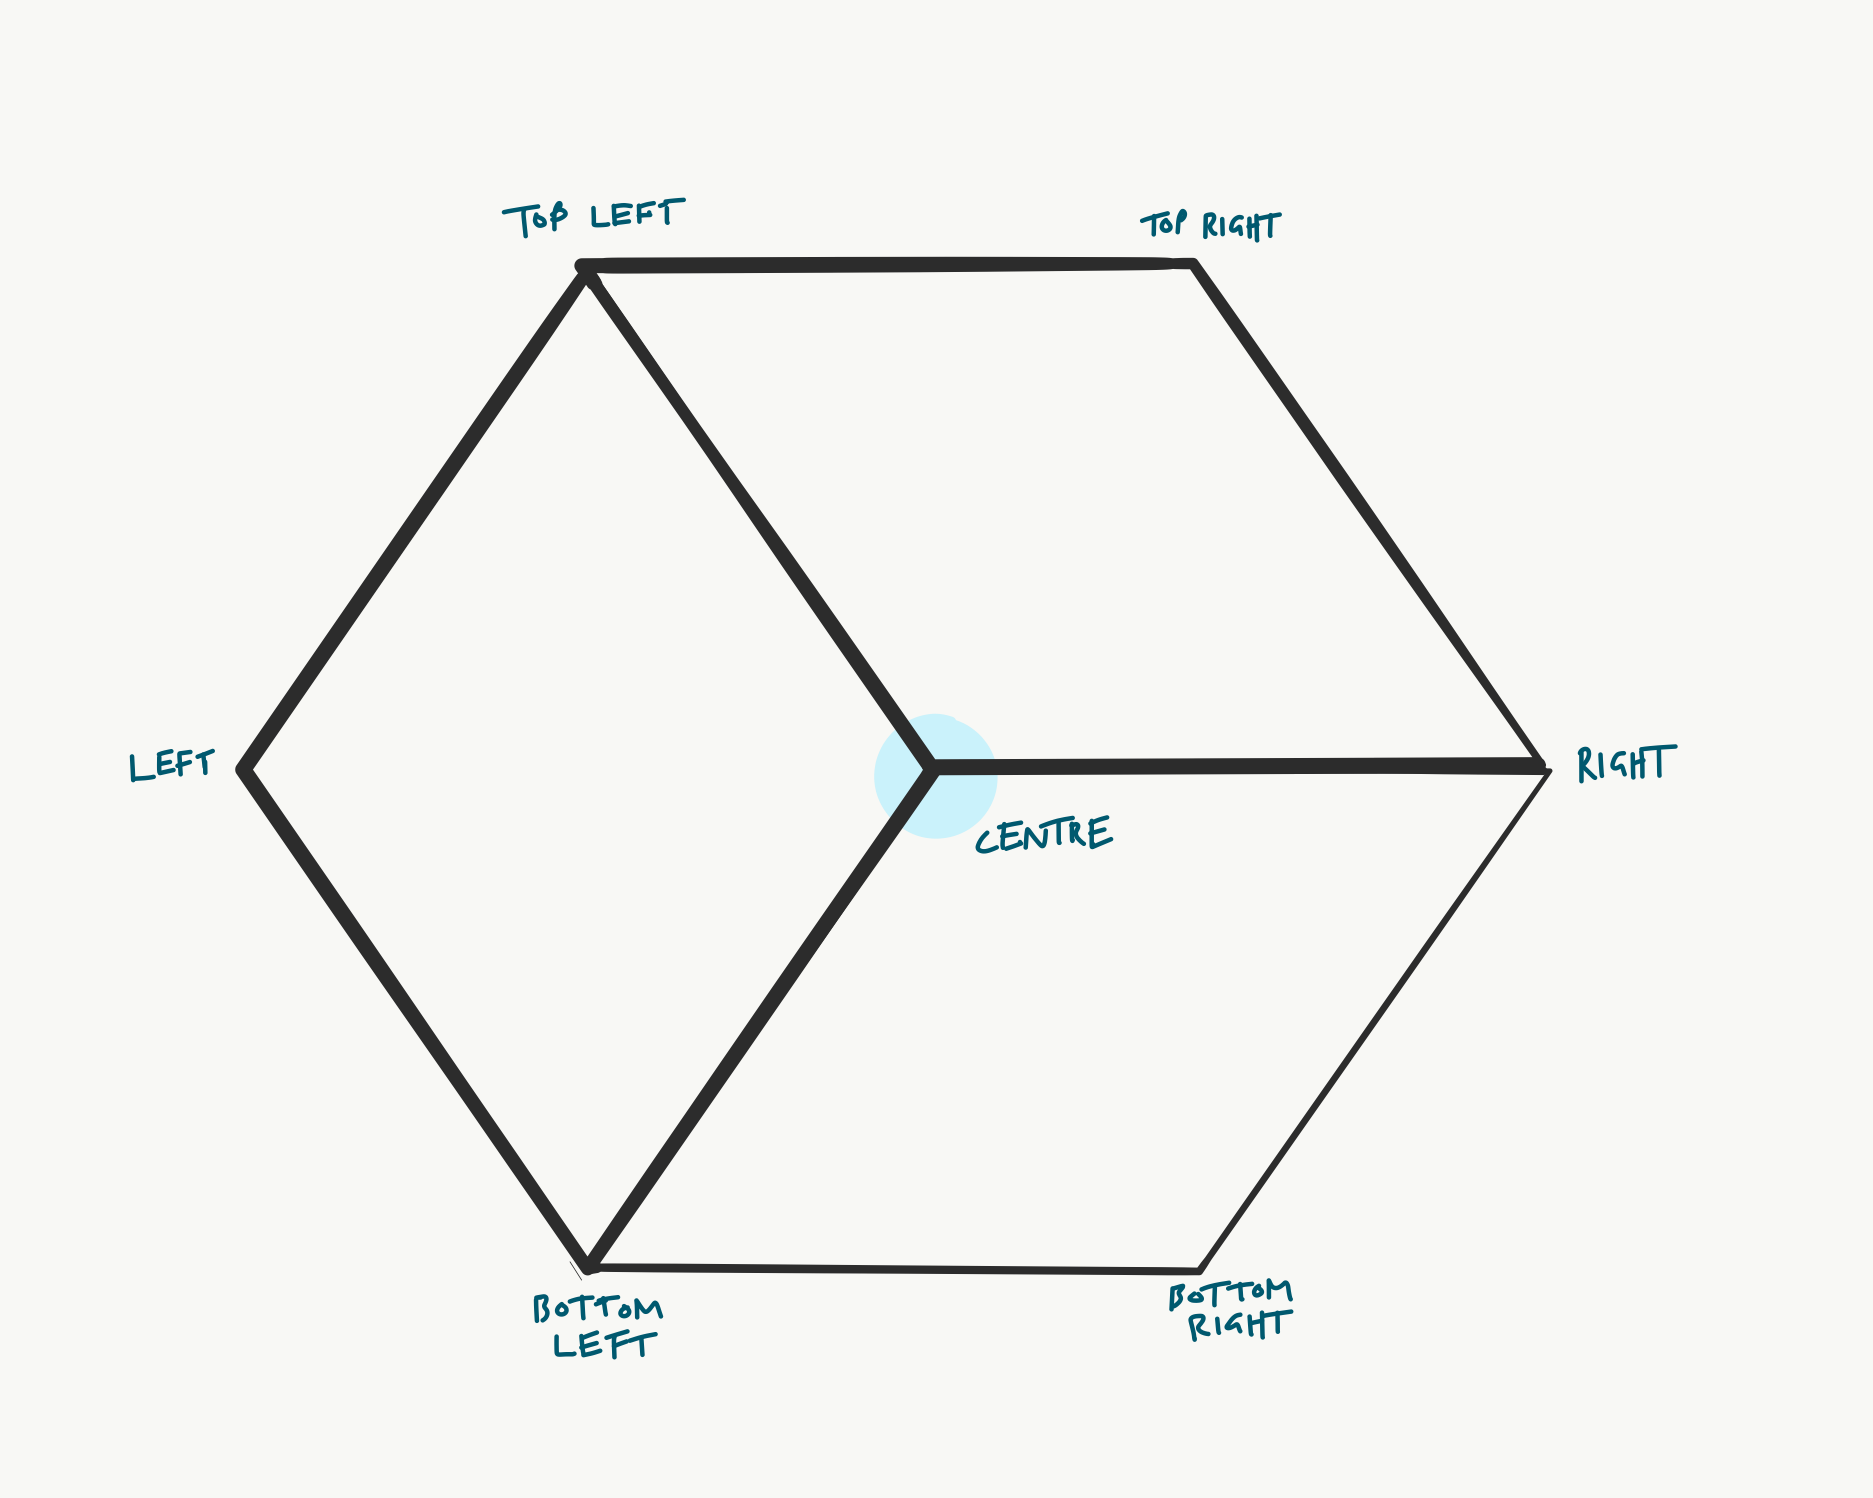
The external shape (silhouette) of the cube is a hexagon, where each interior angle id 60°. Lines from three of these points can be drawn towards the centre to create 3 equal rhombus shapes that look like 3 visible faces of a cube.
All the faces share one point in common, the centre of the hexagon, so I used this as the placement point for the cubes, and calculated the position of all the other points from this shared point. In the class definitions, you can see this point referred to with the variables:
float centerX;
float centerY;
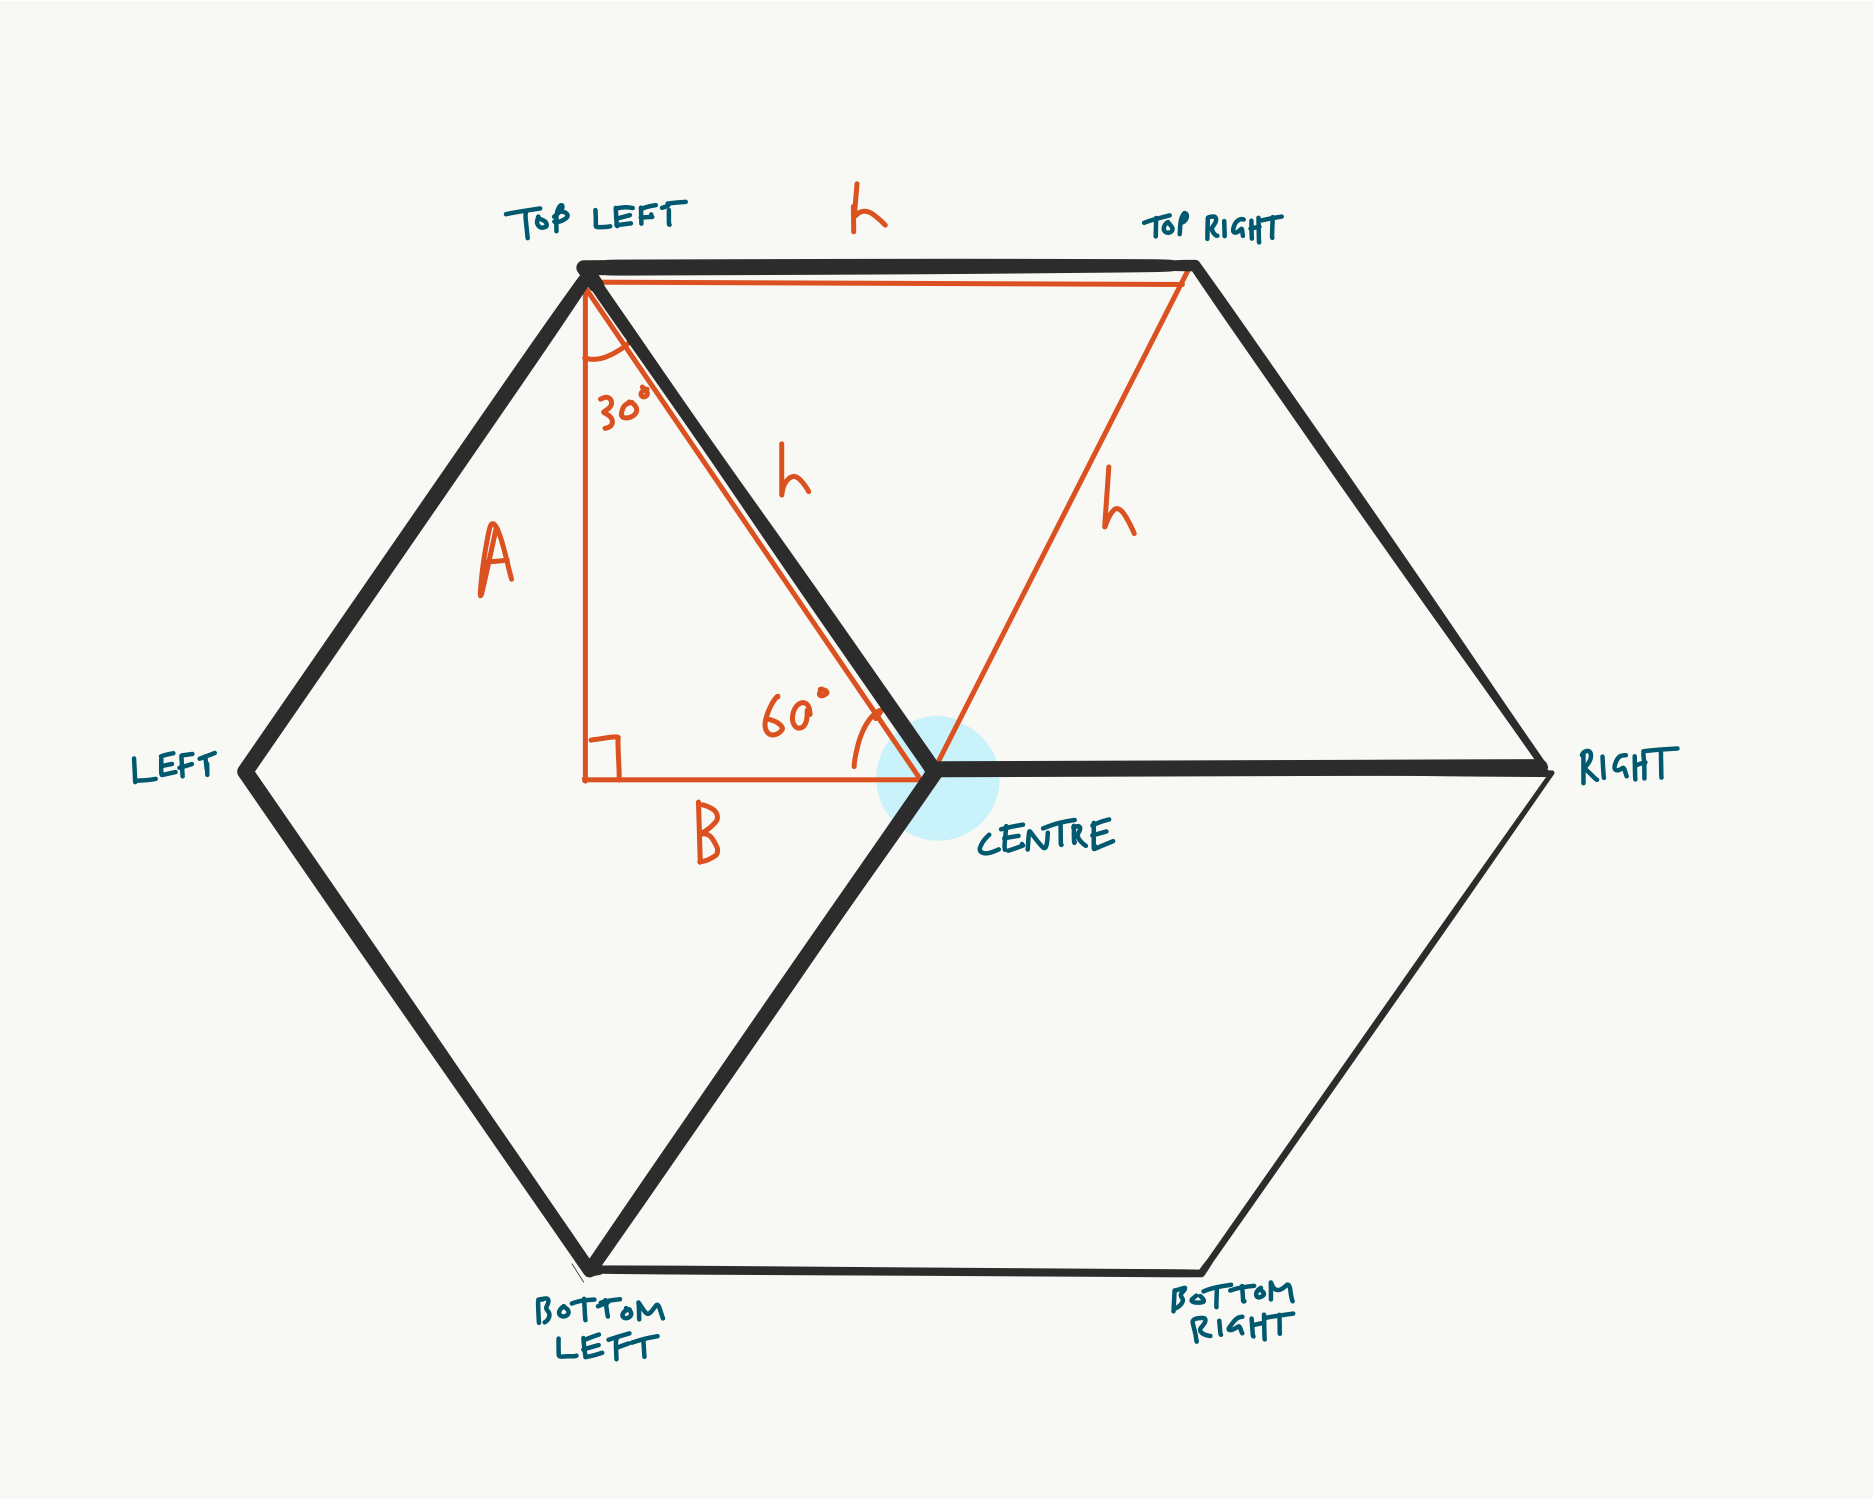
I labelled all the other points as in the diagram below, giving me 7 points in total (i.e. 14 float variables).
The trigonometry of these rhombuses is quite simple, but converting this into cartesian coordinates that I can use to place them on the canvas is a bit fiddly. Fortunately, by looking for right-angle triangles within the shape, where the opposite and adjacent sides are in the x and y axes, we can work out the positions of the points of the shape on an x/y grid. This is how I worked it out, taking the top left point as an example.
I know the following values:
float centerX;
float centerY;
float cubeHeight;
In the diagram below, the length of A is equal to half of cubeHeight.
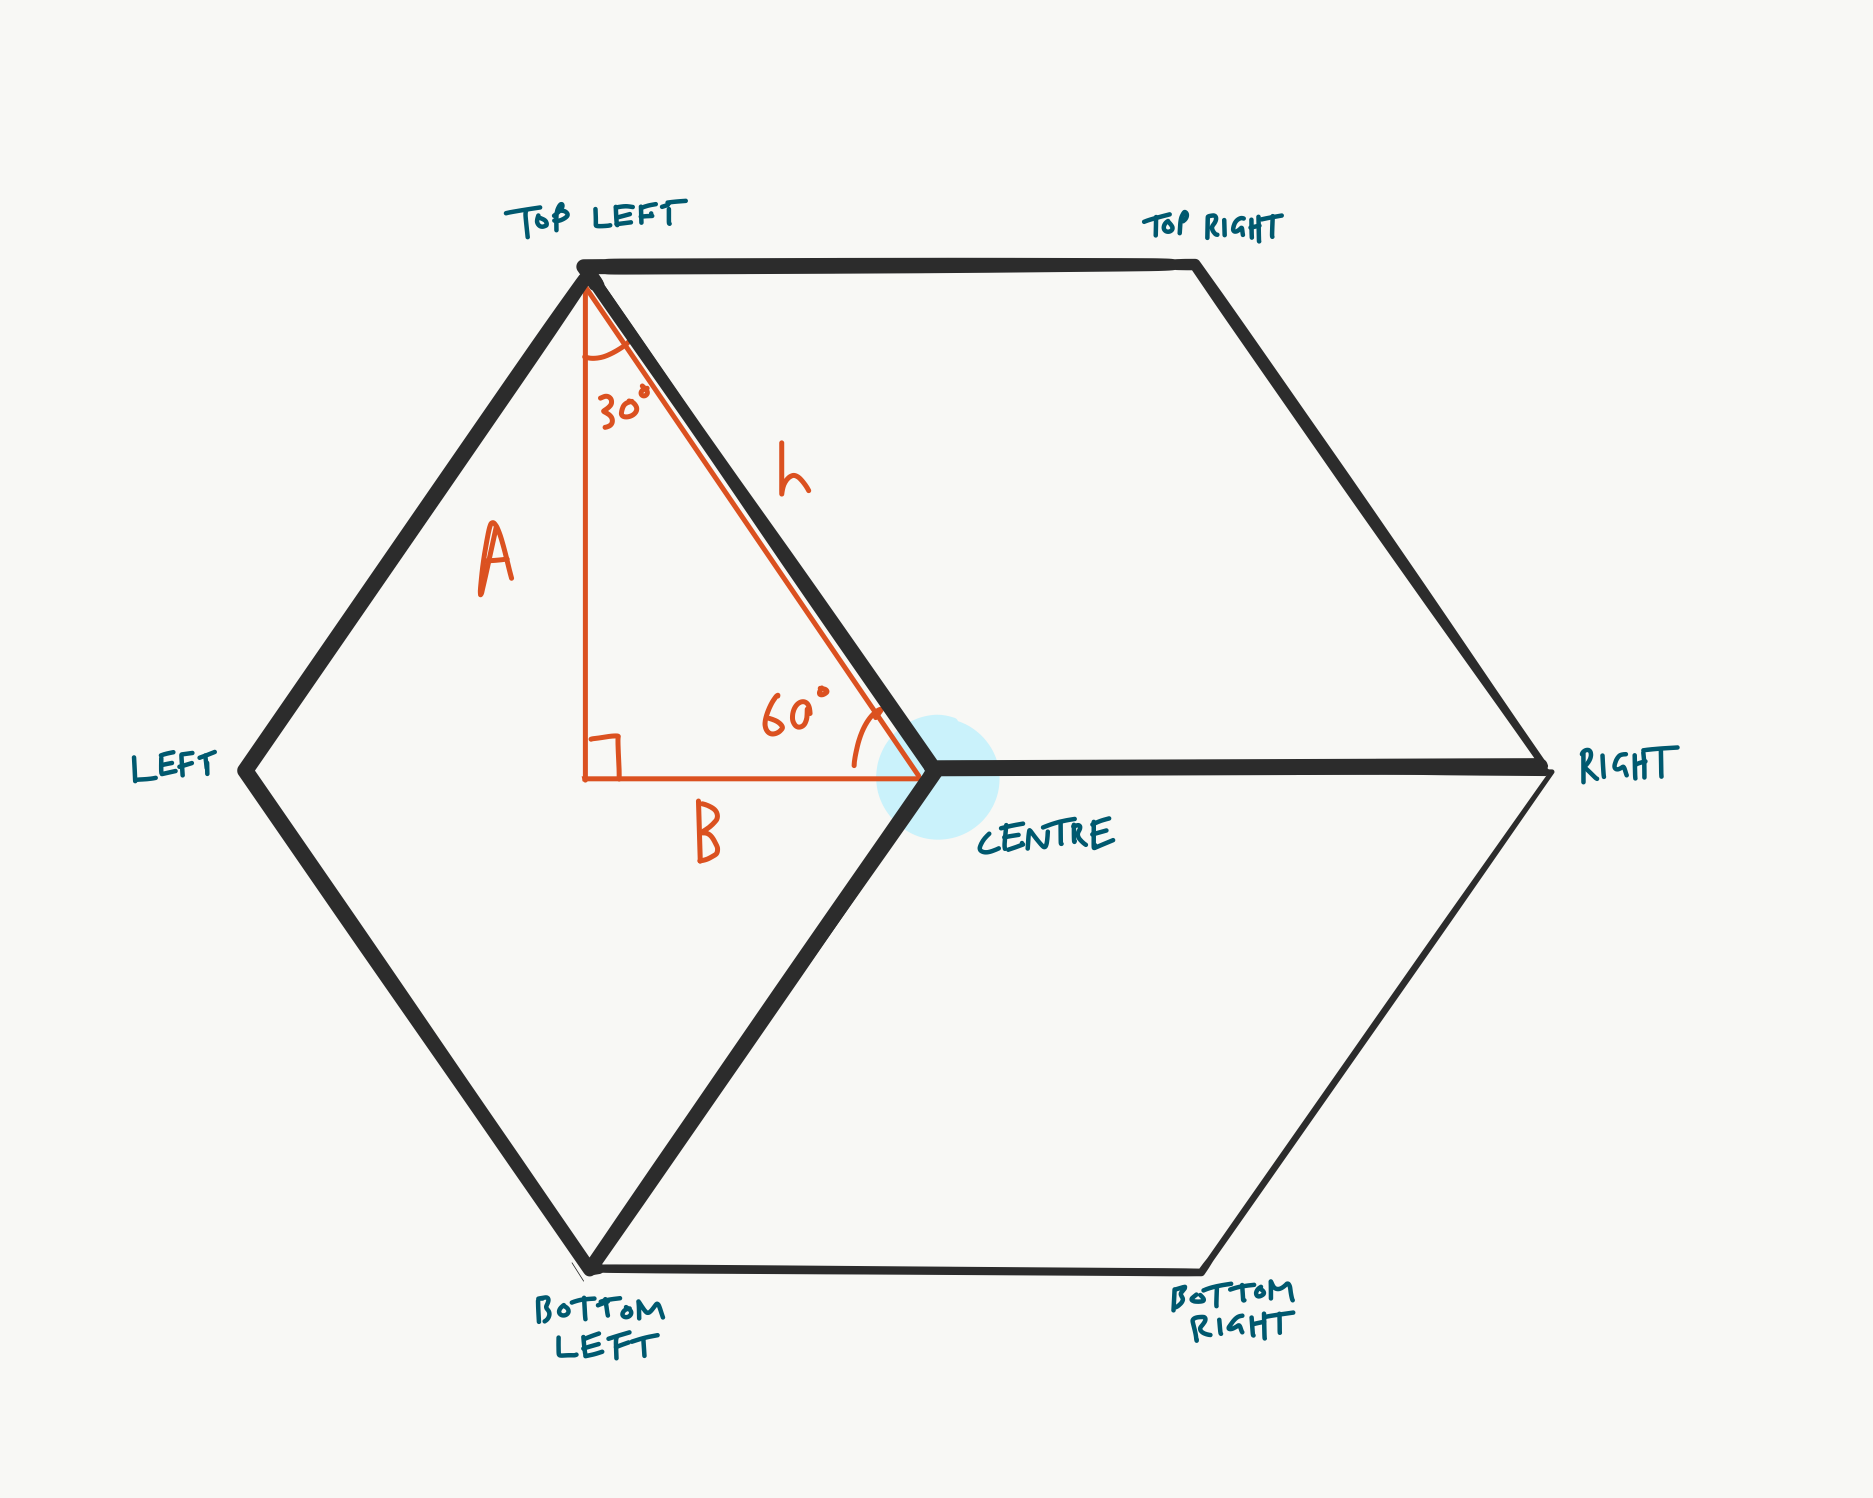
So the length of B can be calculated using SOH-CAH-TOA, as follows
tan(60) = A / B
so:
B = A / tan(60)
In Processing, the tan() function expects us to use radians to express angles, so this could be rewritten in code as:
B = A / tan(rad(60));
or
B = (cubeHeight/2) / tan(rad(60));
The y-coordinate of the left point is the same as that of the centre point, but the x can be calculated relative to the x-coordinate of the centre point like so (remembering that distance to the left point is twice the length of B):
leftX = centerX - 2 * ((cubeHeight/2) / tan(rad(60)));
All the other points can be calculated in a similar way, because the hexagon shape is so simple. For example, the top right point is the same distance from the centre as the top left, and can be calculated like so:
topRightX = centerX + ((cubeHeight/2) * tan(radians(30)));
topRightY = centerY - (cubeHeight/2);
I’m using similar trigonometry to calculate the spacing between each cube on the same row, and the x- and y-offset for alternate rows. Frankly this is all a bit of a mess, and a nasty hack that comes from starting with a row and column-based layout, so this could probably be done better.
Objects within objects
Each cube in the pattern is made up of three visible faces. Each of these is an object, and these objects are declared within the parent Cube() class:
class Cube {

  // data, including objects contained within this one
  // each object is itself a kind of data!
  // see https://www.youtube.com/watch?v=V7k5bFQbhG0

  // declare each face object
  CubeLeft cubeLeft;
  CubeTop cubeTop;
  CubeBottom cubeBottom;

  // and regular old data
  float centerX;
  float centerY;
  float cubeHeight;

  // class continues ...
Then they’re initialised when the Cube() object’s constructor function is called in setup()
  // constructor
  Cube() {

    // initialise each face
    cubeLeft = new CubeLeft();
    cubeTop = new CubeTop();
    cubeBottom = new CubeBottom();

  }
Each of these cube face objects has a display() method, and these are called when the display() method of the parent Cube() object is called:
  void display(float centerX, float centerY, float cubeHeight,
    int cubeLeftColorR, int cubeLeftColorG, int cubeLeftColorB, // left face colours
    int cubeTopColorR, int cubeTopColorG, int cubeTopColorB, // top face colours
    int cubeBottomColorR, int cubeBottomColorG, int cubeBottomColorB // bottom face colours
    ) {
      cubeLeft.display(centerX, centerY, cubeHeight, cubeLeftColorR, cubeLeftColorG, cubeLeftColorB);
      cubeTop.display(centerX, centerY, cubeHeight, cubeTopColorR, cubeTopColorG, cubeTopColorB);
      cubeBottom.display(centerX, centerY, cubeHeight, cubeBottomColorR, cubeBottomColorG, cubeBottomColorB);
  }

} // end of Cube class
An uneven grid
I’ve made repeating patterns before, where objects are laid out on a grid. But this grid is more complex. Each cube is spaced apart to allow other cubes to tesselate with it, alternate ‘rows’ (if you want to think of them that way) are offset from each other, and also have different numbers of cubes in.
In my code, you can see lots of nasty logic to control this. IN retrospect, I think it would be better to come up with some tessellation logic that works more natively with this kind of hexagonal tessellation. Here’s an example of some ugly logic:
if ((currentColumn == (columns-1))  && !oddRow) {
    lastCubeInEvenRow = true;
  } else {
    lastCubeInEvenRow = false;
  }
This tests to see if the cube being drawn is in the final column (remembering that column counting starts at 0), and is on an even numbered row. If so, it doesn’t draw that cube.
It does the job, but it means that if you specify, say 100 cubes, only about 95 will be drawn. The test is also susceptible to data type errors. If either of the variable columns or currentColumn is not an integer, it can fail. (Because the value of columns is calculated programatically (by dividing the width of the canvas by the number of cubes) it is easy for this not not be an integer).
Picking colours
Obviously the Vasarely original colours each cube face differently, an on close inspection, not according to any simple rules. Although there is a general brightening in the centre of the image, it is not an even gradation. Which makes this a poor choice to recreate programatically. But an interesting thing to have discovered thanks to a close examination of the image — art appreciation! So I decided to abandon a faithful interpretation at this stage and just made up some rules to approximate the colours in the painting.
I started by using an algorithm based on the distance of any cube from the centre.
The method for displaying a face expects variables like this:
void display(
  float centerX,
  float centerY,
  float cubeHeight,
  int cubeLeftColorR,
  int cubeLeftColorG,
  int cubeLeftColorB
  )
So one colour value, e.g. cubeLeftColorB can be calculated like so:
int(                                   // Forces it to an integer.
    map(                               // (See the mapping scale below).
        (
          abs(                         // Forces next line to a positive number.
              width/2-centerX          // X distance of centre of cube from
                                       //  centre of canvas.
          ) *                          // Multiplies x and y distances together.
          abs(                         // Forces next line to a positive number.
              height/2-centerY         // Y distance from centre.
          )
          /
          (width/2*height/2)           // Divide the ditance by the maximum
                                       //  possible distance to get a float
                                       //  between 0 and 1.
        ),
        0, 0.8, 164, 58                // Map the range to values I picked from
                                       //  the real painting.
    )
),
You’ll see that the mapping is tuned (0–0.8, not 0–1) because the distances of the centre points are never right up at the corners. And I also flipped the mapped scale around so that higher inputs become lower outputs, and vice versa - because the colours are brighter in the centre, not the edges.
However, most of this is moot, because this algorithm gives the wrong spread of brightness across the canvas. Rather than a central bulge, you get a central cross, with prominent spines along the x and y axes.
So I took a new approach, and reused a sine-based function I’d written previously to give me a smooth bulge of brightness in the centre
float generateSeed(float x, float y) {
  return (
    sin(map(x, 0, width, 0, PI))
    +
    sin(map(y, 0, height, 0, PI))
  ) / 2;
}
This function take in an x and y coordinate, translates each one into a value between 0 and 1, on a sine wave, adds them together and divides the result by 2 to get back to a value between 0 and 1. I can then use the value returned in a much simpler, and more pleasing hue calculation:
int(
  map(
    generateSeed(centerX, centerY), 0.2, 1, 66, 229
  )
)
As you’ll see from the result, the resemblance is not great, but I’m going to leave this here, because what’s much more fun is using interactive variables like mouse position to control the colours of each face, and that’s what I’m going to focus on in the next experiment…