Bezier Waves
The first thing I made in Processing was a pattern generator that draw a load of variable waves to the screen. I wrote it before I got my plotter, and my intention was that I’d be able to use it to generate interesting wave patterns to plot. The code is a mess; maybe I’ll post it here sometime.
Now I’m trying the same thing, but making use of some of the things I’ve learned in the last few weeks, including object oriented programming, and my initial HPGL plotter tests.
One thing I’ve learned from playing around with the plotter is that everything you draw to the screen needs to have an equivalent in HPGL, otherwise you can’t plot it. That’s why I’m using PVectors to draw lines
Both Processing and HPGL use bezier curves to draw curved lines, and the syntax is similar, so I’m going to try and write a wave pattern generator that will work in Processing, but also write the equivalent HPGL commands.
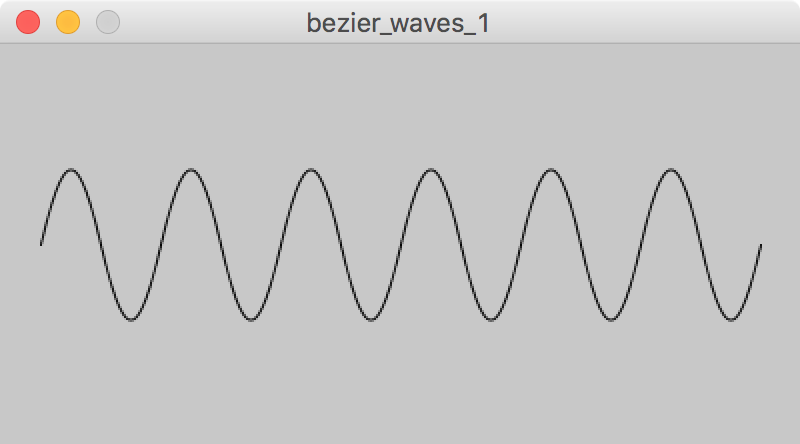
First, lets try to make a simple sine-like wave using Processing’s bezierVertex() function.
Sketch: bezier_waves_1
We set up some basic variables:
float waveHeight = 50;
float waveYCrossover = 100;
float waveWidth = 30;
float waveStartX = 20;
float numberOfPoints = 12;
Then in draw() we loop through all the points of the wave, adding a start and end outside the loop:
beginShape();
vertex(waveStartX, waveYCrossover); // first anchor point

for (int i = 0; i < numberOfPoints; i = i+1) {

  bezierVertex(waveStartX+(waveWidth*PI/8),(waveYCrossover - waveHeight), // first control point
  (waveStartX+waveWidth)-(waveWidth*PI/8),(waveYCrossover - waveHeight), // second control point
  (waveStartX + waveWidth),waveYCrossover);  // second anchor point

  waveStartX = waveStartX + waveWidth; // move the x axis along by the width of the wave for the next curve
  waveHeight = - waveHeight; // flip the wave height over so we get the other side of the curve
}
endShape();
I’m offsetting my control points slightly from the vertical axis of their corresponding anchor points. If you didn’t do this, you’d end up with wave that looked more like a series of semi circles. I’m using a fraction of Pi (multiplied by the wave width) as the offset. I don’t know if this gives me a true sine wave, (probably not) but I’m guessing that maybe the offset does relate to Pi in some way, and this looks good so far…
Sketch: bezier_waves_2
This version uses println() commands to generate HPGL commands that could be interpreted by the plotter. Unfortunately, I think bezier curves might be a feature of HPGL2, which may not be supported by my plotter, so I may have to rethink this. Anyway, it generates this HPGL:
IN;SP1;
PU20.0,100.0; PD;
BZ31.780972,50.0,38.21903,50.0,50.0,100.0;
BZ61.78097,150.0,68.219025,150.0,80.0,100.0;
BZ91.780975,50.0,98.219025,50.0,110.0,100.0;
BZ121.780975,150.0,128.21902,150.0,140.0,100.0;
BZ151.78098,50.0,158.21902,50.0,170.0,100.0;
BZ181.78098,150.0,188.21902,150.0,200.0,100.0;
BZ211.78098,50.0,218.21902,50.0,230.0,100.0;
BZ241.78098,150.0,248.21902,150.0,260.0,100.0;
BZ271.78098,50.0,278.21902,50.0,290.0,100.0;
BZ301.78098,150.0,308.21902,150.0,320.0,100.0;
BZ331.78098,50.0,338.21902,50.0,350.0,100.0;
BZ361.78098,150.0,368.21902,150.0,380.0,100.0;
PU;